© 2024 First Samuel Limited
The Markets
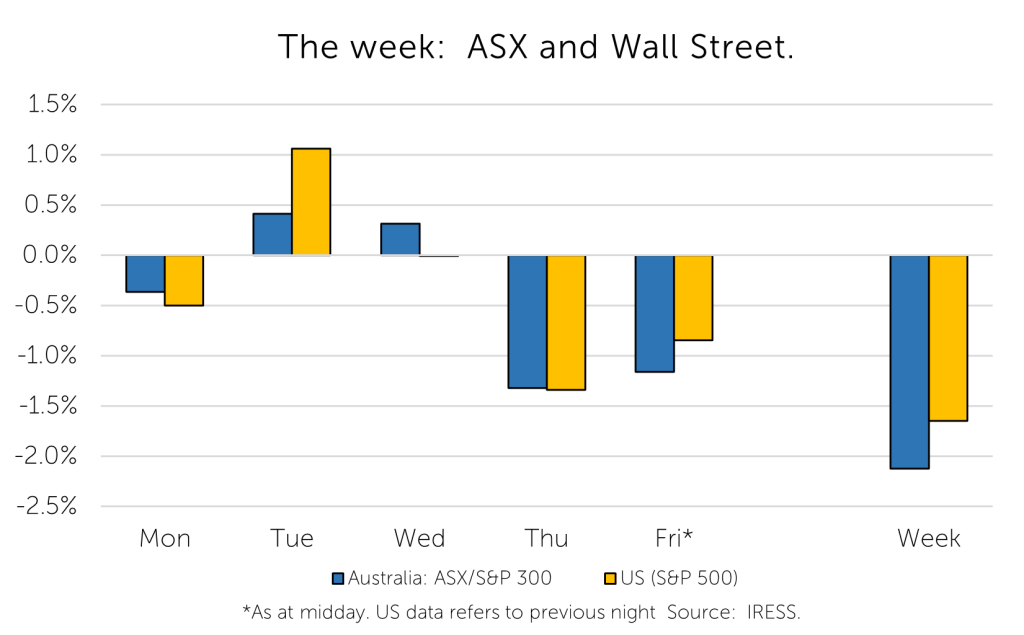
This week: ASX v Wall Street
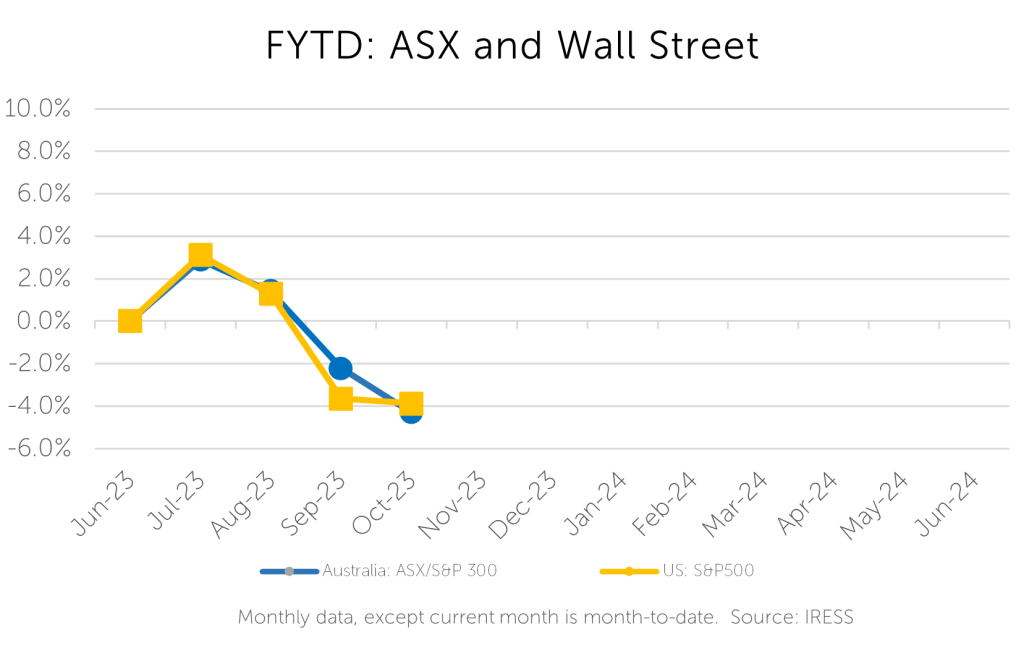
FYTD: ASX v Wall Street
After last week’s Investment Matters, of which I have been informed (despite extensive rewriting by Wry & Dry), was somewhere between “hard to follow” and downright obtuse, I have aimed for less lofty goals than RBA nuance this week.
However, I have stuck with interesting economic data. This week I look at Consumer Confidence and Consumer Sentiment and hope to relate it to longer-term historical trends and current portfolio construction.
When should we be worried about worrying? Consumer confidence.
In a nutshell…
This week produced another dip in Consumer Confidence, as reported by ANZ and Roy Morgan. This is the latest in a stream of weak results that stretches back to 2021, when a relatively tepid rebound in confidence stalled in the face of rising prices, higher interest rates and post-Covid lethargy.
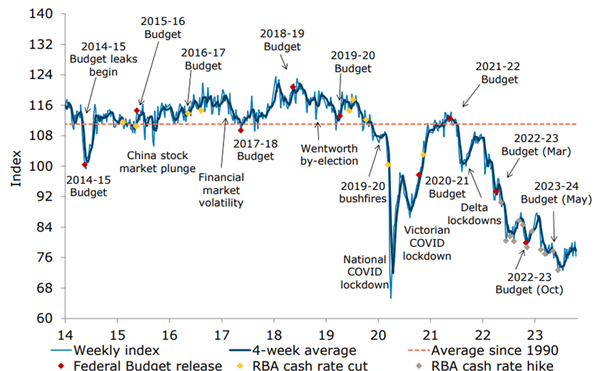
Consumer Confidence numbers are above 100 when there are more confident people than unconfident. Since 1990, the average score of 110 (shown in the red dotted line in Figure 1) indicates a general disposition toward net positive confidence.
Today, however, confidence is hovering in the 75-80 range, a level rarely seen outside of the 1990 recession. In this article, we asked how important to the stock market are the worries of the population?
Figure 1: ANZ Roy Morgan Consumer confidence: – A decade
Source: Microbusiness, ANZ Roy-Morgan, ANZ Research
…and a little deeper
Historically, as shown in the chart above, there has been interesting data from the ANZ-Roy Morgan series around events such as Federal budgets, changes of government and interest rate cycles. There has also been evidence in the past of a link between political leadership malaise and the general level of confidence.
People are generally poor at successfully estimating future events. Despite this, history suggests the survey responses that relate to future events can correlate with future changes in:
- Retail spending
- Investment cycles
- Political agitation
Sometimes movements in confidence are direct results of a change that has happened rather than as a predictor of future events. The best example is changes in RBA interest rates. The grey dots (interest rate rises) in Figure 1 (you will have to look closely), for instance, show a consistent trend of reducing Consumer Confidence this cycle, a pattern that replicated results seen in 2011 and 2012 (before the chart above).
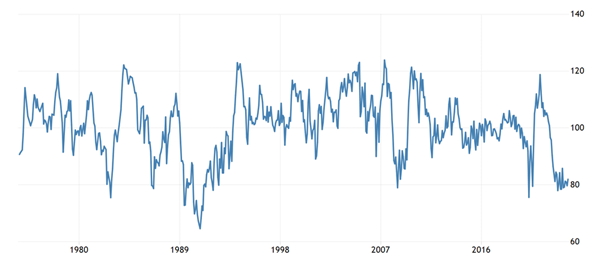
To provide a longer period to compare today’s malaise to history, we can look at the Westpac-Melbourne Institute Consumer Sentiment survey since 1974 in Figure 2.
Figure 2: Consumer Sentiment back to 1974
Source: Trading Economics, Westpac, Melbourne Institute
Consumer Sentiment results are like the Consumer Confidence figures. So, we note that today’s downturn is similar to results from the GFC, where sentiment index levels tended to also lay in the mid-80s, except for a brief dip in 2008.
Almost incredibly, Australian households report similar results today to those during the recession in the early 1990s. In the first year of that downturn, sentiment was similar and only slightly lower in the depths of 1992. Today, unemployment is less than 4% compared to more than 11% in the early 1990s.
And equally fascinating is that despite three years since Covid, current levels are barely higher than those expressed in the heights of shutdowns and health concerns.
What is driving the decline?
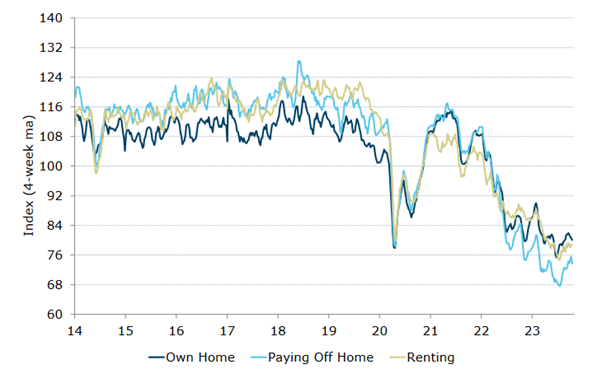
One of the factors that is clear in the decline in Consumer Confidence is the impact of interest rate rises. This should be no surprise for a country like Australia, which is a global leader in household debt to income leverage. Figure 3 below shows confidence amongst mortgage holders, owners and renters, Confidence amongst those paying off a mortgage (light blue line in table below) has deteriorated much more than those who are renting or own their home outright.
Figure 3: Confidence by housing tenure
Source: ANZ Roy Morgan
The pleasing element of recent results is that those households with a mortgage appear to be becoming more confident.
Are there more silver linings in the data?
Based on the overall confidence figures, we could conclude that weak confidence drives poor future outcomes. But generally, it doesn’t work out that way. To understand why, we can take a look at the details that drive the confidence measure.
Consumer confidence is a combined measure that includes the relative level of positivity versus negativity towards a set of questions. As noted above, when the score is above 100 there are more “confident” people than unconfident people. Confidence itself is a function of:
- Perception of the current financial position of the respondents as compared to 12 months ago – that is, are you better off or worse off?
- Perceptions of how your financial position will be in 12 months
- Perceptions of how the economy in general will be performing in 12 months
- Perceptions of how the economy in general will be performing in 5 years time
- Is it a good time to by a major household item?
A small contributor of the decade-long trend to lower “confidence” seen in Figure 1 can be attributed to weaker confidence in the statement that today is “A good time to buy a major household item.” Major household items have become a smaller part of household budgets than houses themselves or to the range of goods and services we consume. At the same time, it appears the idea that it is a good time to buy has also decreased.
So, a silver lining to the weak data is the unimportance of a reduction in confidence to buy a major household item.
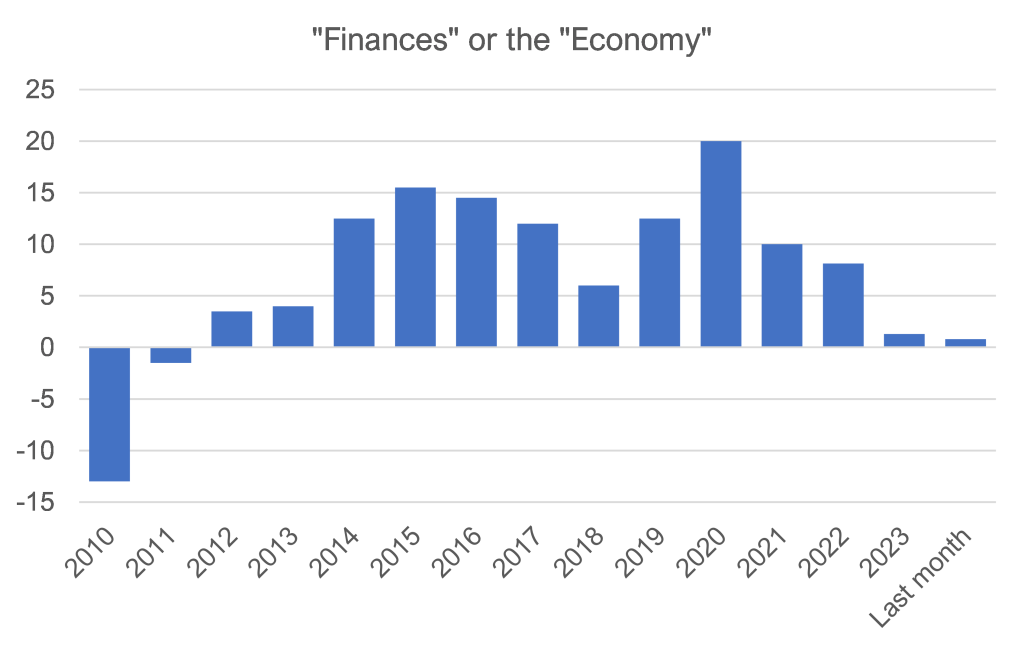
Another silver lining in the fall in overall confidence is shown by breaking down the figures into features that relate to either personal finance or confidence in the economy in general. Both Figures 5 and 6 are First Samuel analysis.
We would contend that the mere facts of inflation and rising rates would create angst with respect to finances. Angst driven by the economy without seeing impacts on personal finances may be more important to the stock market.
Figure 5, below, shows the yearly average drivers of difference between personal finance factors and overall economic factors. The higher the blue bars, the more worried people were about the economy than their finances. For instance, during Covid (2020) people were far more worried about the economy in general than their personal finances (government support was high, savings were high).
Today the angst is predominantly due to higher rates and inflation – the blue bar at its lowest level since 2011.
Figure 5: Personal Finances or Confidence in the economy?
Source: First Samuel, ANZ Roy Morgan
The remaining silver lining from a long-term equity investor perspective is the resilience of household responses that measure optimism and personal outcomes.
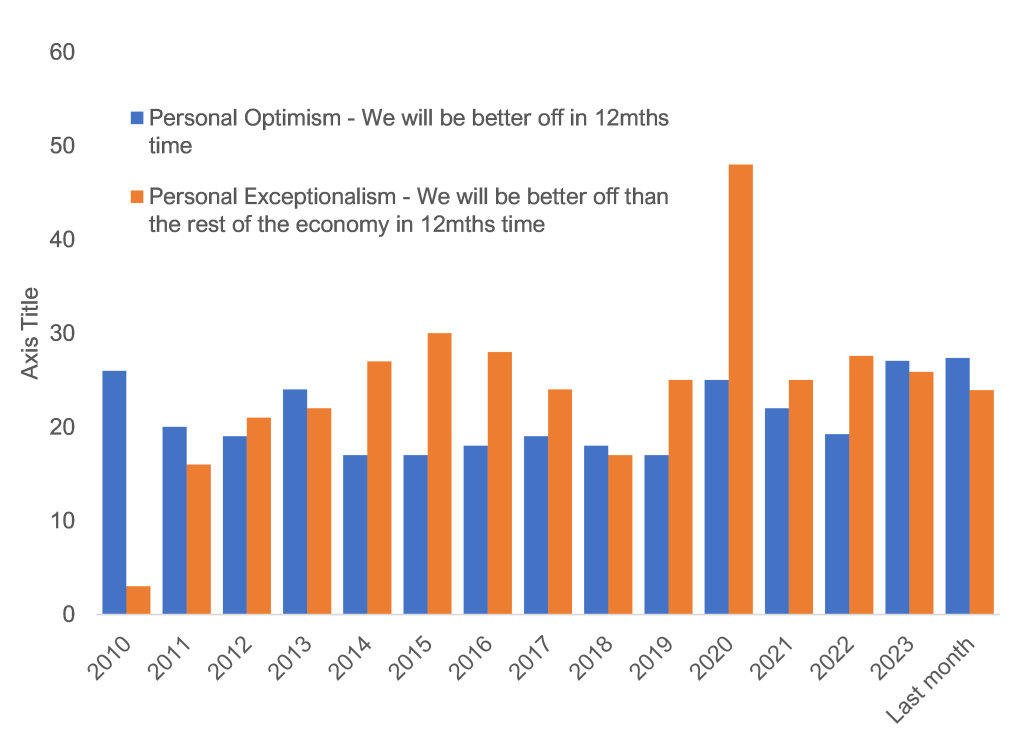
Figure 6, below, uses the underlying results to test two outcomes: how much more confident are people of the medium term (five years’ time) than today (Personal Optimism), and how confident are people that their outcomes will be better than the outcomes of the economy (Personal Exceptionalism).
Figure 6: Personal Optimism & Personal Exceptionalism
Source: First Samuel, ANZ Roy Morgan
The figure clearly shows (in blue) that Personal Optimism in the future (relative to today) is just as high as ever, even though we are comparing to a baseline that is less confident than ever.
Similarly, households’ confidence that their outcomes are likely to be better than the overall outcomes of the economy (orange) is much higher than we saw at the beginning of the decade. Critically, it has barely changed in the past three years. The only time people were more generally concerned but personally confident was during the Covid period.
Summary
Consumer confidence continues to be at historically weak levels. In the short term, it has been shown that these levels are correlated recent changes in interest rates and with future weak consumer sales and political angst. However, we do not believe that by themselves, they are a precursor to an economic breakdown for these reasons:
- Households’ confidence in the future in relative terms remains strong, consistent with continued investment, household formation and moderate economic growth.
- Households’ view of their outcomes relative to others in the economy remains positive, which should also support investment and household spending.
We believe that the nuance of a more positive view lies in the combination of very strong employment, government support for infrastructure investment and strong population growth. The principal concerns of households and the principal driver of overall confidence remain the outlook for interest rates and the necessary time it takes for those with mortgages to respond and adapt to higher rates.
This process has begun, and without future rises, offers the hope that underlying confidence in the future converts to more upbeat sentiment in the present.
The information in this article is of a general nature and does not take into consideration your personal objectives, financial situation or needs. Before acting on any of this information, you should consider whether it is appropriate for your personal circumstances and seek personal financial advice.

