


© 2024 First Samuel Limited
The Markets
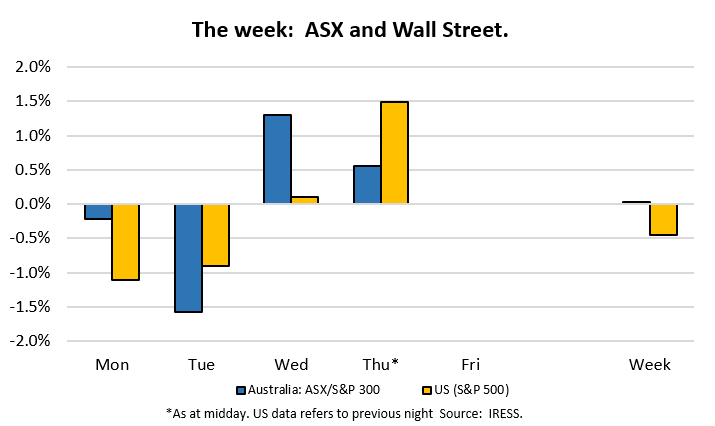
This week: ASX v Wall Street
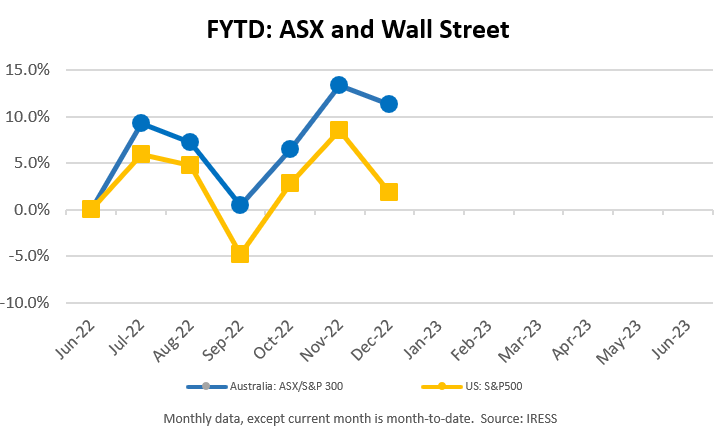
FYTD: ASX v Wall Street
The final Investment Matters of 2022 is a weighty one. First Samuel’s CIO, Craig Shepherd, puts together the critical pieces in the mosaic of interest rates. It is worth the patience needed.
RBA ‘minutes’
The Australian market was rocked on Tuesday following the release of the most recent RBA ‘minutes’. Officially known as the Minutes of the Monetary Policy Meeting of the Reserve Bank Board, they are released in the week following each monthly decision and provide interested people with a picture of nature of the discussion that surrounded the decision.
A quick refresh, from RBA marketing material, about what RBA is trying to do:
- The Reserve Bank has an inflation target to achieve the goals of ‘price stability, full employment, and prosperity and welfare of the Australian people’.
- Australia’s inflation target is to keep consumer price inflation between 2% and 3%, on average, over time. The inflation target is flexible and allows for temporary fluctuations in inflation above or below the target.
(https://www.rba.gov.au/education/resources/in-a-nutshell/pdf/inflation-target.pdf)
The shock news from these minutes was the degree to which the board was actively considering raising interest rates in Australia by 0.50% (50bps) instead of the more passive 0.25% (25bps) increase that was eventually chosen.
Perhaps incorrectly, the market had thought the RBA was closer to pausing interest rate rises that the commentary suggested. In the short-term, higher interest rates create greater risks for the economy and stocks alike – so share markets lost value on the day (ASX300: -1.6%). It had recovered all lost ground by end of the week.
The minutes contained elevated rhetoric regarding the inflationary signals in the economy, and concerns about wage growth. Some passages of relevance are included below.
“The arguments for a 50 basis point increase stemmed from the fact that inflation remained too high and the economy continued to operate with excess demand.”
“Some other economies had earlier been in a similar situation to Australia and had subsequently seen wages growth pick up strongly, which risked high inflation becoming entrenched.”
“the cash rate “ is “not yet at a high level historically and, if the Board ultimately needed to move to a more restrictive policy stance, it would take some time for this to dampen demand.”
(Minutes of the Monetary Policy Meeting of the Reserve Bank Board, 6 December 2022)
Are these concerns reasonable and should the result lead to much higher rates?
The inflation dilemma
In this final Investment Matters for the year, I have included 5 slides to tell a story about long-run inflation in Australia.
History would warn against the expectations that inflation can easily be subdued. And caution policymakers about the relevance of fighting for an inflation target that may not be reflective of the global conditions over the next 20 years.
The differences between various policy paths chosen could be significant for investors. Consider two:
- Inflation stays above 3%, especially domestic inflation supported by wages growth, BUT the RBA allows rates to remain near current levels. In these circumstances the Australian share market is particularly attractive at current prices.
- The RBA to deliberately engineer a recession in parts of our economy that are heavily focused on interest rates, such as housing. The dislocation reduces short-term growth, to achieve an inflation outcome (2-3%) that wasn’t desirable in the first place. The share market takes a further 1-2 years to grow at full potential.
The point made in the following slides is that, firstly, inflation targets have rarely been achieved by the RBA itself, and secondly, the extent to which other constraints on household budgets and global inflationary forces remain, the idea that we should be worried about wages growth at this point in the cycle is jumping the gun at best.
The logic
So, let’s go to the slides, and step through the logic.
- At a Core level (removing volatile items), inflation has been remarkably well controlled within the RBA target band (pink shaded area)
- Variation in headline CPI can be driven by fuel, floods, global pandemics and tax settings (e.g. GST)
- Inflation post COVID has surged.
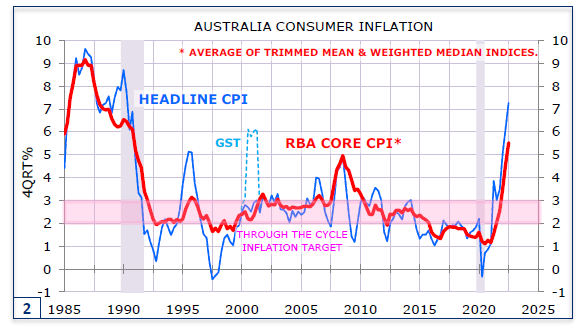
Source: Minack Advisors
However, the true story of inflation “within the target band” has largely been achieved by Australia importing deflation from countries such as China.
We can see this in the difference between “non-tradeable” and tradeable inflation. Non-tradeable items in the CPI basket are produced here and aren’t easily substituted from overseas – good examples of non-tradables include health, most services and education.
Tradeable items include those that are entirely imported and those produced here that compete with similar items from other countries. Since 2000, the more China, and Japan and Korea before them, invested, the less we made here, the more scale and cheaper capital and wages drove down prices and the cheaper these goods became.
The chart below clearly shows that domestic inflation (non-tradeable) averaged in excess of 3% for 20+ years. The RBA hasn’t controlled inflation within the band by itself.
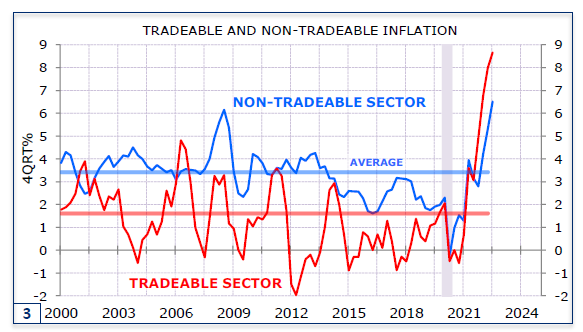
Source: Minack Advisors
What drives non-tradable inflation – wages?
Many factors ultimately drive inflation, including regulation, bureaucratic inefficiencies, weak technological transfer, rigidities in laws and institutions. However, it is generally accepted that wages growth is key.
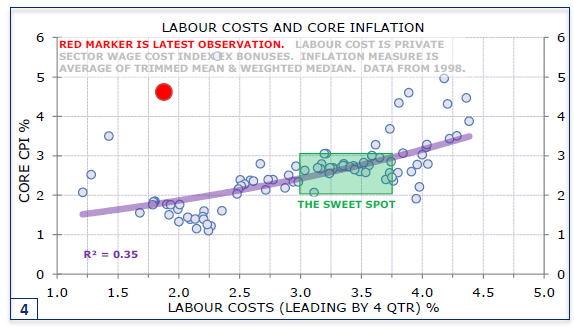
Wages growth is what the RBA identified as the key risk in their notes on Tuesday, and the chart below shows there is a relationship (albeit weak) between labour costs (X axis) and future core inflation (Y axis).
The chart also shows the effectively mythical “sweet spot” where wages and inflation produce the Goldilocks solution, not too hot not too cold, on either wages or inflation. Of course, the probability of achieving this outcome is there for all to see – count the dots that fall out versus fall in the square since 1998.
Source: Minack Advisors
Conditions today are shown by the RED dot.
Its position when compared to every other data point since 1998 shows how extraordinary the impact of the policy settings around COVID have been. With very limited wage growth in Australia we have high inflation, that is inflation not driven by wages growth. This we understand: current inflation is more due to excess liquidity in the economy, and disruptions in supply chains.
The period of chronically low inflation between 2015 and 2019 was characterised by exceptionally weak income growth. Many of the dots in the chart above that have low inflation and low labour costs relate to the period of 2016 to 2019.
RBA Concerns
But did not the RBA minutes show that the RBA was worried about future wages growth?
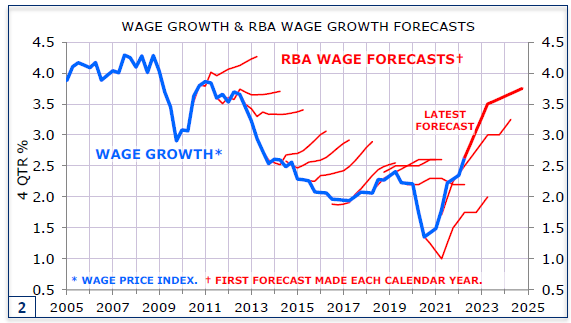
Yes, however this concern is “situation normal”, and should be taken with a grain of salt. Ever since our economy was changed permanently following the GFC, with lower interest rates and dramatically higher migration, the RBA has continued to get its forecasts for wages wrong – and always the same error – by assuming they will rise faster than they ultimately do.
With hindsight, between 2016 and 2019 it is likely that the economy was too heavily constrained due to an incorrect assumption about wages growth. This is what the market feared in this week’s statement. Would the RBA, actually believe their forecast (presented in the charts below) and raise rates too fast and too far, only to be wrong about wages again.
Source: Minack Advisors
What if wages growth doesn’t arrive?
Now the concern become clearer: the RBA might be targeting the wrong number. Assuming wages growth that never arrives, what could happen?
Let’s understand the period in between 2016 to 2019 when inflation was contained through low wages growth. During that period, we avoided a recession, and markets performed well.
Could we do this again, forgetting for a moment the likelihood the rest of the world is no longer sending us deflation.
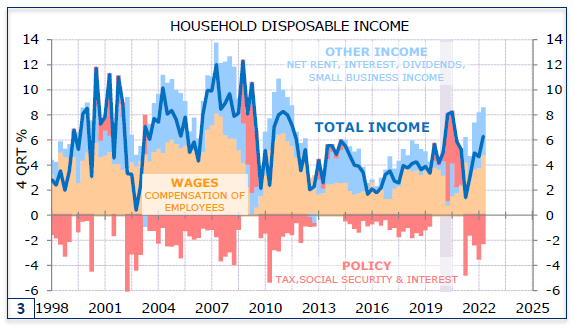
To answer we need to understand what other support the households received in that period. To see this, I have included my absolute favourite economic chart.
The chart shows the composition (by colour) of what drives income growth for households. ORANGE is growth due to wages and employment; BLUE is capital income (mainly dividends but also farm and small business profits), and RED is the impact of taxes and transfer payments along with changes in interest paid (mainly from mortgages).
The total of all three provides the BLUE line which is total income growth. To understand how it works, consider two periods
- Between 2016 and 2019 total income growth was reasonable and inflation was low. Critically, there was limited drag from RED as few new taxes and limited changes in interest rates affected households.
- Through COVID (2020-1) the positive impact of transfers (JobKeeper etc) and dramatically lower mortgage interest rates saw the usual drag from RED reverse and be positive. This meant household income growth was quite strong without significant wages growth.
Source: Minack Investors
Now lets looking forward to what the RBA sees going forward.
The RED bar is about to get much more negative with higher mortgage interest rates feeding through households from recent policy changes and the lagged impact of people rolling off fixed rate mortgages in the next 2 years. The quantity of debt now held by households in 2022 means relatively small rises in interest rates will have the same large negative RED impacts as during 2008 and 2011.
On top of rising interest costs, bracket creep (with inflation higher) will continue to take higher levels of tax, and some of the remaining transfer payments associated with COVID support will disappear.
What if wages growth doesn’t arrive?
In this environment, we need strong wages growth (not wishful forecasts) to protect households from stalling. The idea of hitting the brakes with a further 50 bps rate rise now, before wages grow arrives seems to overstate the importance the inflation target in the first place.
Will the RBA make such a mistake? I do not believe so, the combination of muted wages growth (compared to forecasts) and the natural unwind of supply chain blockages will see inflation drift towards the 3.5% levels that non-tradable inflation has been for 25+ years.
It will be above the official RBA target band, but for the right reasons: wages growth that supports employment and debt servicing. It will not simply be an inflation target delivered because China was over-building factories to reduce the price of footwear and flat screen TV’s.
Fingers crossed.
The information in this article is of a general nature and does not take into consideration your personal objectives, financial situation or needs. Before acting on any of this information, you should consider whether it is appropriate for your personal circumstances and seek personal financial advice.