


")
© 2024 First Samuel Limited
This week’s Investment Matters will focus on different asset classes, their relative performance, and our broad thoughts on the implications of tactical asset allocation decisions.
The Markets
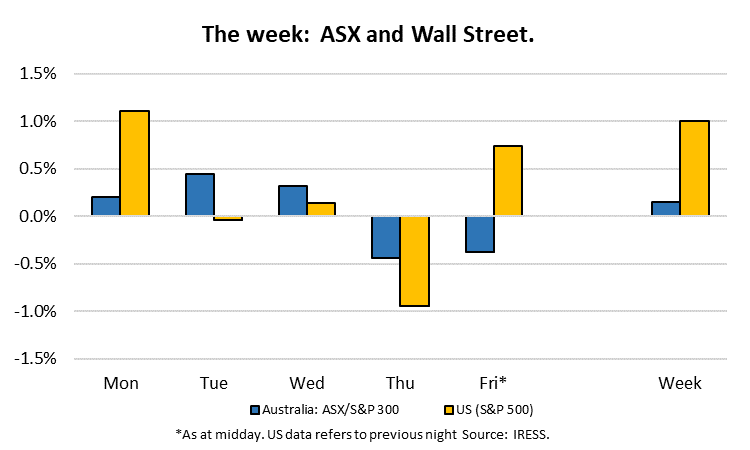
This week: ASX v Wall Street
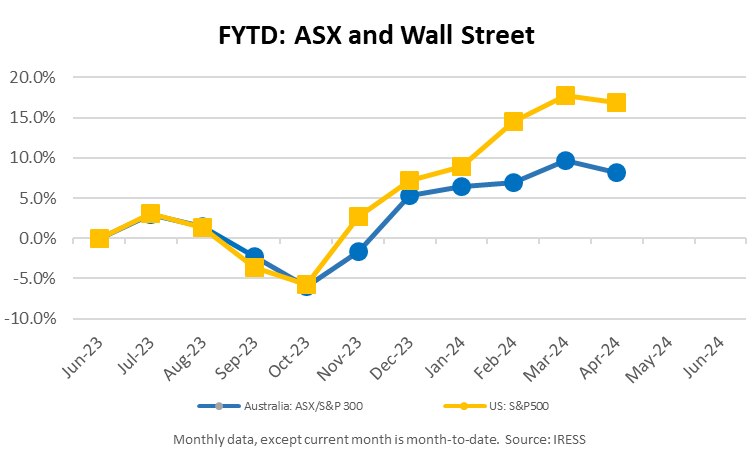
FYTD: ASX v Wall Street
Sector Returns – Financial year to 31 March 2024
As we recently showed in the monthly CIO video for March, overall returns in our portfolios have been strong.
When we survey benchmark performance, we see that Australian and Global equities portfolios have delivered returns well above expected long-term returns for those asset classes this financial year.
| Sector Returns | Benchmark |
| Australian Equities (ASX300 Accumulation Index) | 13.30% |
| International Equities (Unhedged MSCI Index) | 19.81% |
| Income Securities – 50% mix of credit and bonds | 4.19% |
| Property Securities (XPJAI) | 29.78% |
Domestic and International Equities
Understanding what drives this outperformance is essential. To do so, we introduce two components of asset price growth: (a) growth in earnings, and (b) growth in the amount markets will pay for such earnings (referred to as PE expansion).
Global equities have rallied more than 40% since late 2022. However, global economic and corporate profit growth has not been as strong as share market performance.
Below is an excellent chart from Gerard Minack at Minack Advisors that highlights this point.
Gains in global equities outside the US and gains in US equities outside the “Magnificent Seven” (i.e. Apple, Microsoft, Amazon, NVIDIA, Google, Telsa, Facebook) have overwhelmingly been driven by PE expansion (both are circled in Figure 1, which attributes equity price gains since the start of 2023 to either EPS or PE changes).
Figure 1 : Share market Index returns disaggregated
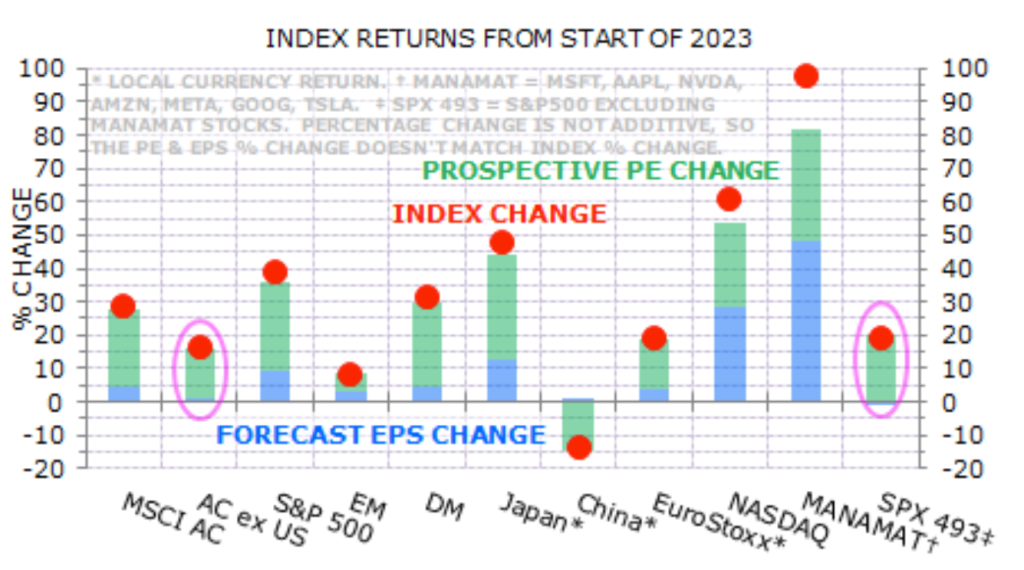
Source: MSCI, IBES, DataStream, Minack Advisors *MANAMAT or the Magnificent Seven – Microsoft, Apple, Nvidia, Amazon, Meta and Alphabet (Google) Telsa. SPX493 represents the US S&P 500, excluding the MANAMAT stocks.
Each of the bars represents a major share market index or market:
- MSCI is a global share market index
- AC is MSCI excluding USA
- S&P500 is the US share market
- EM is emerging share markets (including China and India)
- DM is all developed markets, including Europe and Japan
- EuroStoxx is euro-denominated stocks
- NASDAQ is the tech-heavy component of the US share market
- MANAMAT refers to the “Magnificent Seven”
- SPX493 is S&P500 minus the “Magnificent Seven”
Interpretating the chart
Red – The Red dot represents the actual percentage change in the represented Market Index since Dec 31, 2022.
Blue – represents the change in prospective earnings over the period, i.e. Earnings Per Share growth. In effect, this means the rate of profit growth. A company with a higher level of earnings growth (for a given level of profitability) will typically generate more capacity to reinvest in its business and therefore be more valuable.
Green—The bar chart’s green component represents the share price change driven by PE multiple expansion. An expansion in PE multiples represents an increase in investor enthusiasm or optimism about future growth. In a lower growth environment, which the global economy is experiencing at present, the premium paid for growth may become higher, i.e., growth may become more sought after.
When the price increase (RED DOT) is explained chiefly by the GREEN bar, we are in a period or a market with significant PE expansion. When explained mainly by the BLUE bar, we are in a period of profit growth.
Explaining the chart using an example:
MANAMAT is an amalgam of successful companies that are growing quickly.
The blue bar shows that earnings growth for the seven stocks is almost 50%. However, the green bar, the price the market is willing to pay for that growth, has also risen by 35%. The combination (multiplied together (1+50%) times (1+35%)) is a 100 per cent increase in the share price since the start of the calendar year 2023.
Using the correct ratios at the time, we can illustrate the magnitude of the optimism for these ‘Mag 7’ stocks.
Imagine a basket of these stocks producing $10 of earnings in 2023. At the beginning of the year, the P/E of those stocks was 21.5, i.e. the market was willing to pay 21.5 times for that amount of earnings, or $215, to own the basket with stakes in each.
By the end of the period, the market was expecting $14.5 in earnings from the same companies. Earnings have grown by $4.50 for the basket in just over 12 months. But the market is now willing to pay 29 times for this fast-growing earnings stream, or $420, for the basket!
The ‘basket’ is generating $4.50 more in earnings, but the price of the basket has risen $205. That is a lot to pay for a small increase.
What are market participants implicitly saying?
We suspect the optimism that has generated an outcome such as that witnessed since early 2023 is too optimistic.
The mismatch between markets and profits is not always a problem; for instance, the market will anticipate an increase in profits in rapidly improving conditions. Similarly, in a period in which a collapse in the economy is expected, the market will sell off in anticipation of a collapse.
It is always up to market participants to assess the merits of the market’s foresight.
While the increase in the premium paid for growth in MANAMAT stocks has been most notable, it has also been a phenomenon witnessed across most equities markets in the past 15 months. As a result, almost every market in the world has become more expensive, with higher PEs (Figure 2).
Figure 2 : Cycle-Adjusted Price Earnings multiples
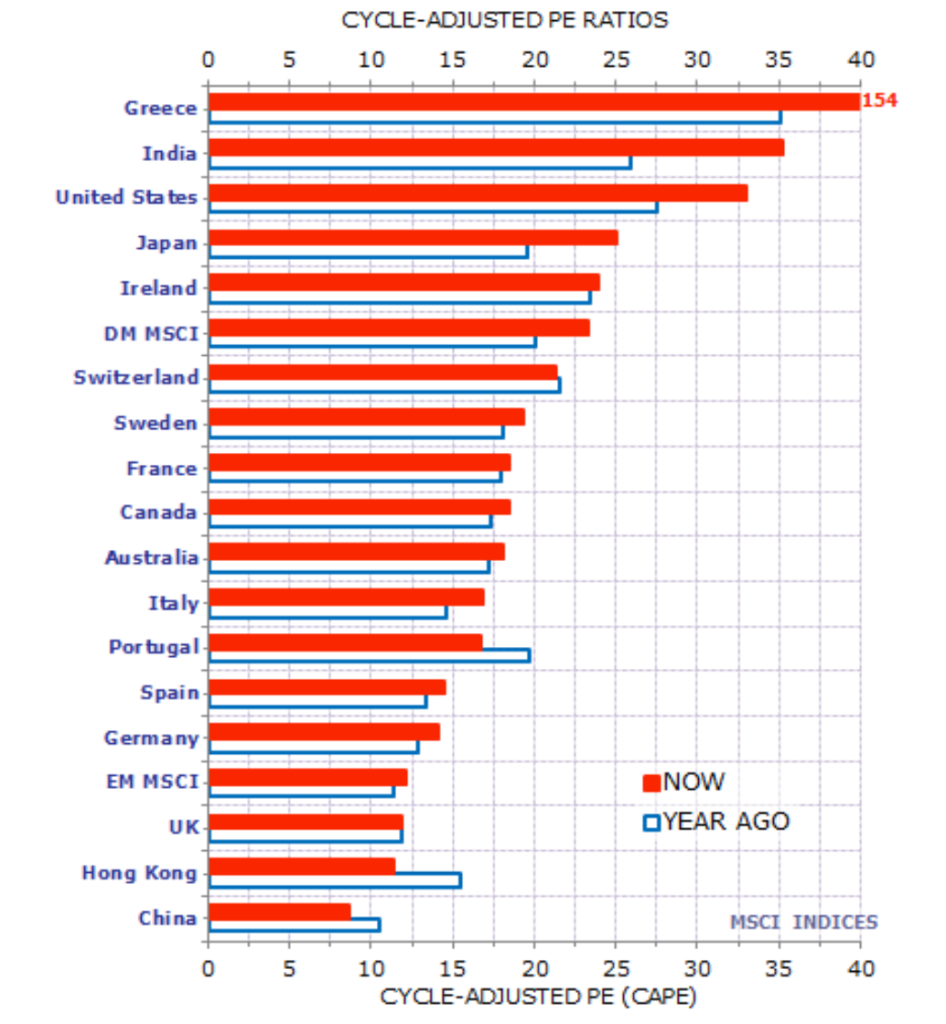
Source: MSCI, IBES, DataStream, Minack Advisors
The most notable exception to this broad enthusiasm prevailing in markets has been in China & Hong Kong, where the local economy has been negatively impacted by a trend towards less cross-border trade flows and the prolonged effects of covid lockdowns on domestic demand within the economy. Overinvestment/speculation in the property sector has also been brought to bear within a domestic context. The underperformance of the Chinese share market has been a multi-year phenomenon.
How are we reacting?
Given the relatively expensive US market, we have increasingly sought opportunities that reduced our exposure to expensive US stocks.
We are tilted towards Europe and still see relative value in these markets. We have also benefited from the PE expansion trends, with more exposure to Japan, a market that has seen both PE expansion and earnings growth over the past twelve months.
Domestic Equities
As we discussed in our recent CIO video, the prospective Price Earnings multiple for the Domestic Market is close to all-time highs, excluding the extremities of the market around COVID-19 as the outlook for earnings collapsed.
As the buyer’s strike in China has gathered pace in the past year, it has positively affected flows into the Australian domestic share market, driving higher the share prices of the large caps and the major banks in particular h. (See Figures 3 and 4 below).
Figure 3 : PE multiple in the Australian market and Fig 4 . ASX Industrials ex Banks, REITS)
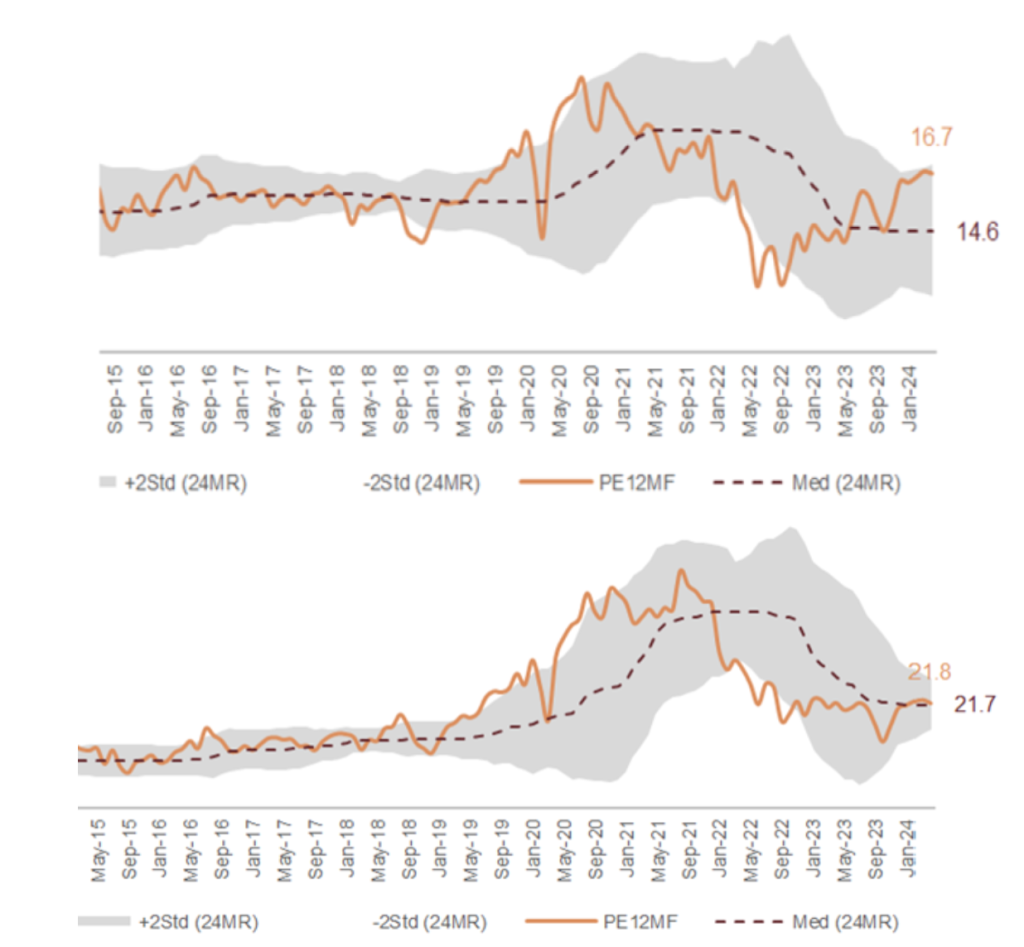
However, the market is reasonably priced when we exclude the costly domestic banks and the strong rally in REITS (RHS chart).
We have continued to move our focus toward the sectors of the market that present the most value, and in general have a portfolio which is substantially cheaper than the market as a whole in PE terms.
Alternatives – Private Equity and Venture Capital
Private equity net asset values defied the decline in listed equity valuations in 2022. The subsequent rally in equities suggests that those private equity marks are now more defensible (Figure 5).
Clients will notice a few price movements in their First Samuel Alternatives’ sub-portfolios. There has been a dearth of activity in the sector, especially mergers and acquisitions, as the market for these assets tracks sideways.
Figure 5 S&P500 and Private Equity returns in the past decade
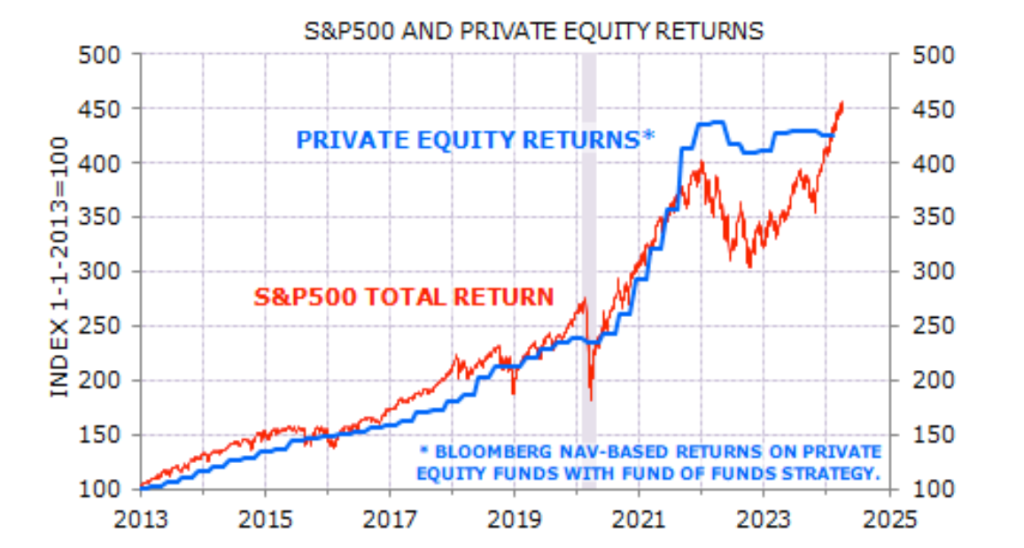
Source : Bloomberg, MSCI, Minack Advisors
Underneath the limited price activity, a range of financing deals have still been executed, and clients have benefited from additional positions being created. We anticipate that the lacklustre activity will end in the coming 18 months.
Fixed Interest/Income
The relative return on equities versus sovereign bonds and other forms of income securities is correlated with the macrocycle.
However, equities’ outperformance over the past year has been much stronger than cycle indicators would normally justify (Figure 6). The chart below shows the difference between equity returns and bond returns (red line) and compares it to the “Leading Index,” a set of forward-looking economic and financial indicators.
Figure 6 : Economic trends, Equity and Bond returns
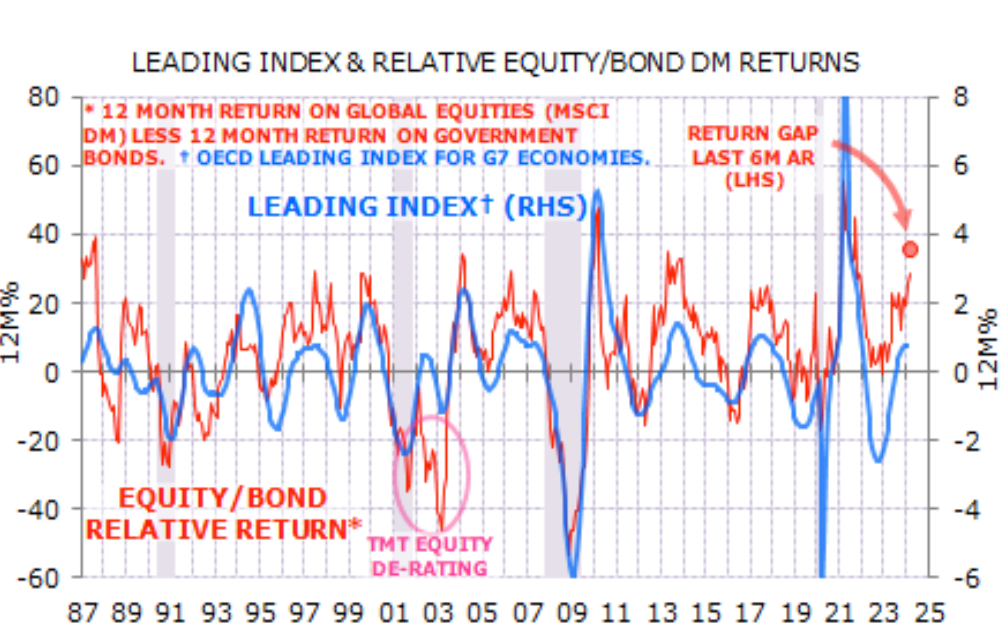
Source : OECD, Bank of America/ICE, MSCI, NBER, Minack Advisors
Treasury yields are typically correlated with real cycle indicators: yields rise when growth accelerates and fall when growth slows. However, the relationship broke through the last Fed tightening cycle. The last time there was such a disconnect was the 1984-85 soft landing. Indeed, a soft landing is precisely what markets expect this time around.
When these circumstances hold sway, the best sector for investment in income securities is in private or corporate debt markets. Such securities benefit from improving conditions and expectations and also receive the benefit of higher interest rates. Clients would be aware of our significant exposure to private credit and funds such as Metrics that invest in such sectors.
In Summary
This financial year has provided strong returns to both Australian and global equities. The returns have moved ahead of the witnessed improvement observable in actual financial conditions, presuming both the economic outlook remains favourable (soft landing) and interest rates have peaked and will begin to fall.
In these conditions, the returns for equities have moved ahead of those achieved in income securities. Private equity and alternative assets have stalled.
We are reacting to these conditions in two ways.
- We agree with the general sentiment of a soft landing, lower rates and improving conditions, especially in the nominal economy (i.e. including inflation).
- However, we are aware that certain asset classes and subsectors of equities have blown past reasonable prices. We are moving away from them both in an international portfolio context and also within the Australian equities’ portfolio.
We believe movements such as these, especially pockets of excess optimism, are not structural concerns for the market but natural oscillations/recalibration of the market and the economy as its transitions from COVID disruption and near-zero interest rates.
We are excited about the way your portfolios are positioned for this evolution.
The information in this article is of a general nature and does not take into consideration your personal objectives, financial situation or needs. Before acting on any of this information, you should consider whether it is appropriate for your personal circumstances and seek personal financial advice.